Introduction
To display or remove these functions from the instrument panel, select the "Eco" theme (see Information displays – introduction).
Driving statistics are also stored and can be displayed in the form of a bar chart (see Trip computer – Trip statistics).
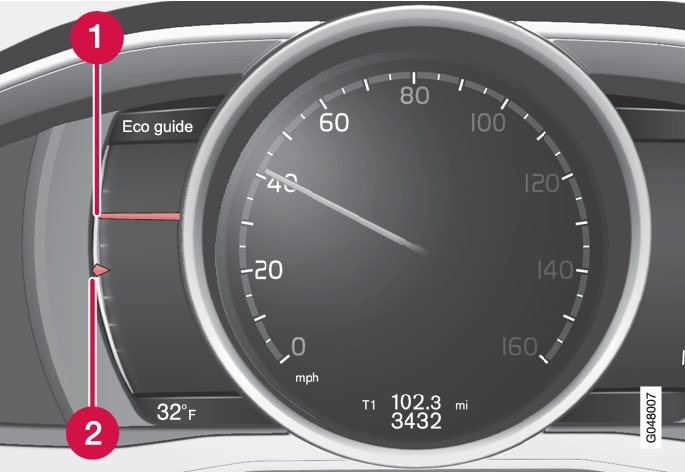
Eco Guide
This gauge gives an indication of how economically the vehicle is being driven.

 | Current (instantaneous) reading |
 | Average |
Current (instantaneous) reading
This is the current level of economical driving; the higher the reading, the more economically the vehicle is being driven.
This value is calculated based on the vehicle's speed, engine speed (rpm), engine load and brake use.
The optimal speed range is between approximately 30–50 mph (50–80 km/h), preferably at as low rpm as possible. The markers fall when the brake or accelerator pedal is pressed.
If the current reading is very low, the red field in the gauge will illuminate after a slight delay, indicating low driving economy.
Average
The average reading changes gradually according to changes in the current reading to indicate how economically the vehicle has been driven recently. The higher the average reading, the more economically the vehicle has been driven.
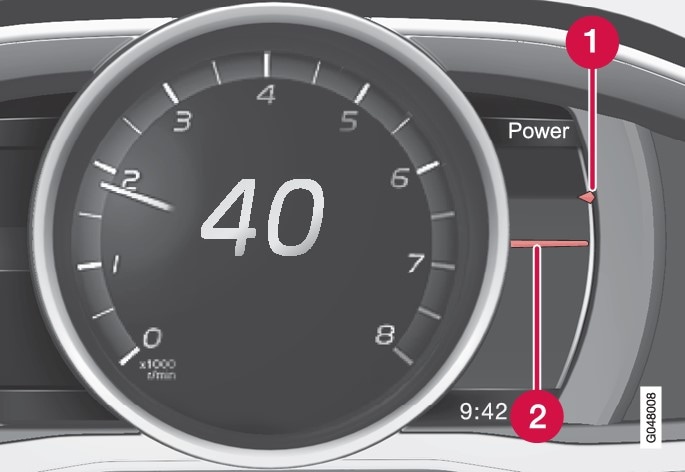
Power Meter
This gauge indicates the engine power that has been utilized and the amount of power remaining.

 | Available power |
 | Utilized power |
Available power
The smaller, upper indicator shows the engine's available power1. The higher the reading on the scale, the greater the amount of power remaining in the current gear.
Utilized power
The larger, lower indicator shows the amount of engine power that has been utilized1. The higher the reading on the scale, the greater the amount of power that is being utilized.
The larger the gap between the two indicators, the greater the amount of power remaining.